CHINESE ACADEMY OF SCIENCES

-

- China’s technological research capabilities see steady growth
- (NO.176 June 2021)
- Issue NO:News in Brief Updated:31-07-2021
The common method of patent layout analysis is to use the patent classification system (IPC/CPC) for statistical analysis, but not for analysis of industrial technology fields. And classical citation co-occurrence analysis has shortcomings too.
A research team from the Institutes of Science and Development of the Chinese Academy of Sciences (CASISD) has developed a more scientific and reasonable method for technology structure discovery.
The purpose of the report is to describe the current global technological landscape, enabling experts and policymakers to intuitively observe the development trends of frontier technologies and allow science and technology to better serve the economy objectively and thoroughly, said Professor Pan Jiaofeng, President of CASISD.
According to the reports “2021 Technology Focus” and “Mapping Technology Structure 2021”, both released on June 4, the researchers used deep learning models to learn the characteristics of patent texts. They then trained a dedicated patent text feature extraction model, and used it as a basis to draw a panoramic patent structure map and form a patent technology hotspot database.
Among the 7,375 technology focuses in 32 areas of the four technology divisions of electrical engineering, instrumentation, chemistry, and mechanical engineering given by the World Intellectual Property Organization (WIPO), the “2021 Technology Focus” report selects the top 100 technology focuses, based on data from the World Technology Focus database, and provides detailed interpretation of certain key technology focuses.
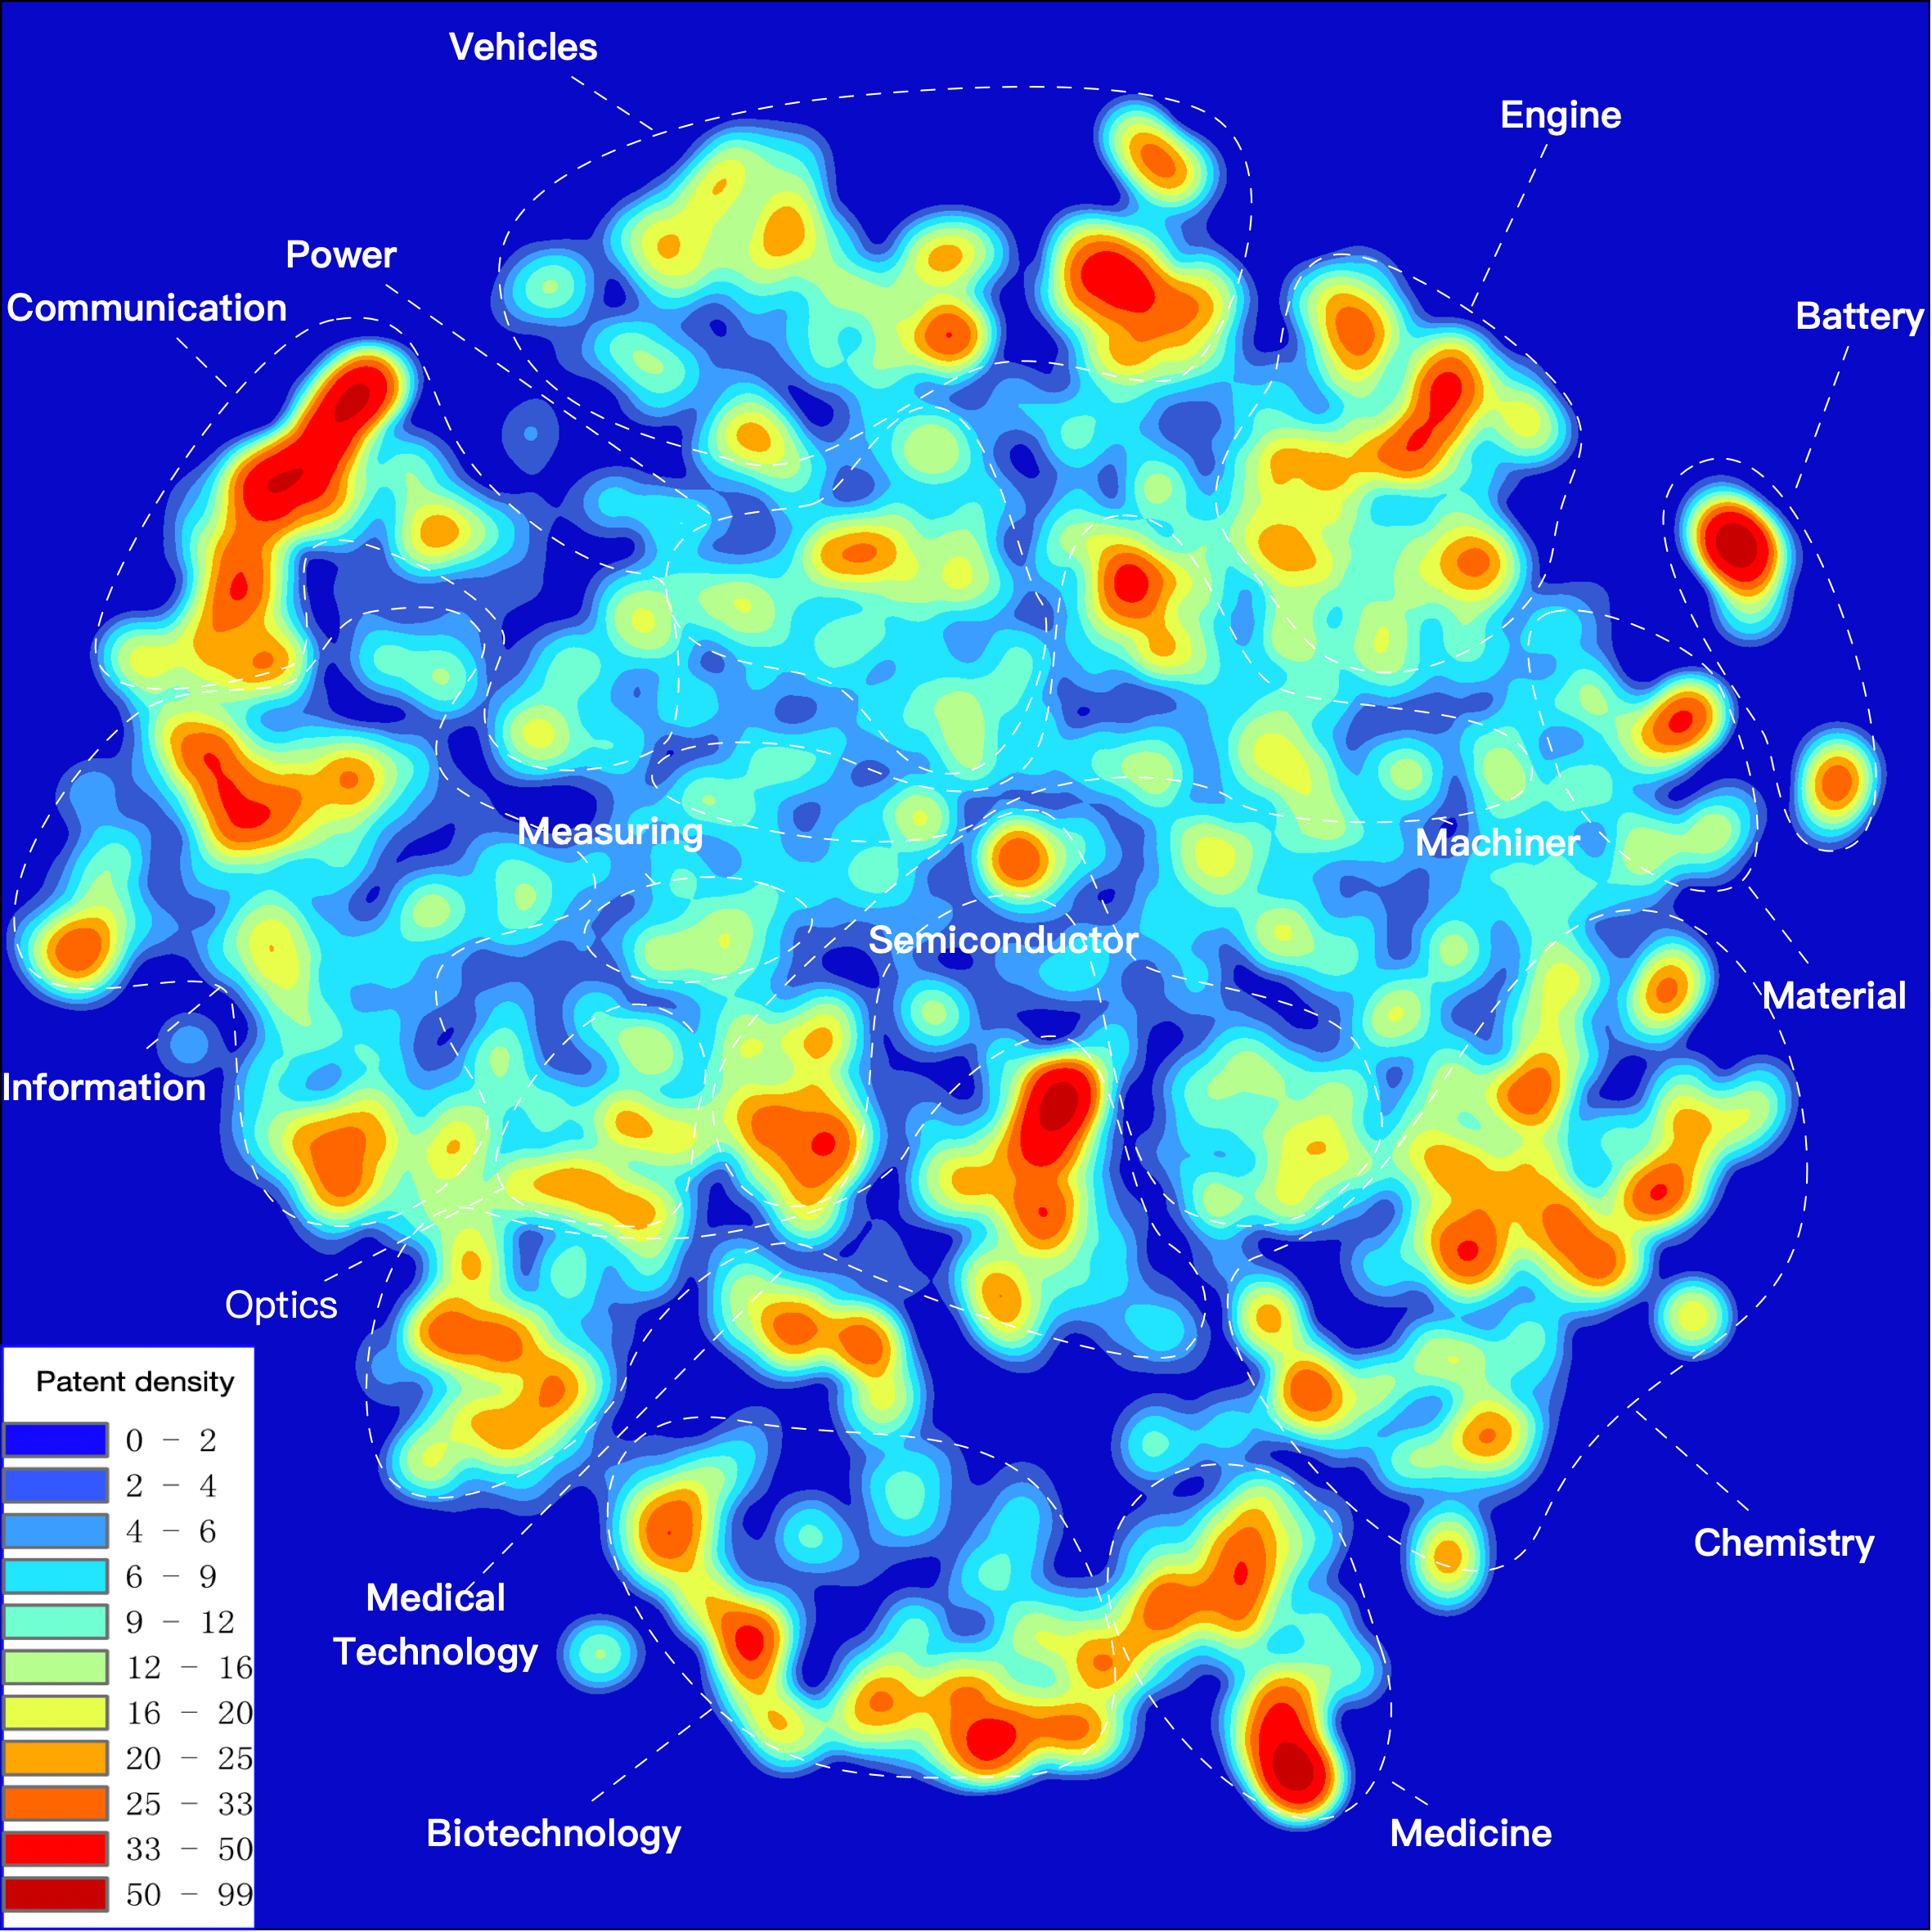
Fig. 1 Mapping technology structure: the larger the number of patents, the greater the density and the brighter the color; on the contrary, the smaller the number of patents, the lower the density and the darker the color. Technology focus areas are circled based on density contours, and these areas are identified by their technology focuses which is helpful for the understanding of the technology structure. [IMAGE: CASISD]
From Fig. 1 we can see that at the top of the map are four technology focuses: vehicles, engines, power, and communication. On the left, there are three technology focuses: information, measuring, and optics. On the right, there are three technology focuses: materials, batteries, and chemistry. At the bottom, there are three technology focuses: medical technology, biotechnology, and medicine. In the middle, there are two technology focuses: machinery and semiconductors.
It can be seen from the technology structure map that the world’s triadic patents are centered on three industries of information and communication technology (ICT), medical devices and pharmaceuticals, and automobiles and other vehicles. Other major industries also include chemical engineering, metallurgy and equipment manufacturing. Most technology focuses are located in very concentrated areas, while the technology focuses of semiconductors, medical technology, and machinery in the middle of the map are seen with several obvious sub-focuses (See Fig. 1).
This study suggests that China’s technological research capabilities have seen a steady growth from 2014 to 2019, by contributing 12,284 (4.5 percent) of the global total number of “triadic patents” within this period.
Professor Wang Xiaomei, a researcher from the institutes and one of the key authors of the report, said that China is the only country among the world’s top six holders of triadic patents that is still experiencing relatively fast growth in this field. “However, creating more high-quality patents is one of the major challenges for China”, she said.
From 2014 to 2019, China ranked fourth in the world in terms of the total number of triadic patents, with communication and information technology being the nation’s most technologically advantageous field.
Meanwhile, China is noticeably behind, both in the diversity and total number of triadic patents, compared with other technological powerhouses such as Japan, the United States and Germany. For instance, Japan held 91,618 such patents from 2014 to 2019, followed by the United States with 71,658 and Germany with 20,793.
“Medical technologies, biomaterials, machine tools and engine design are technological fields featuring high-quality patents in which China needs considerable improvement to catch up with other major economies,” said Professor Wang.
So far, CASISD has formed a series of scientific and technological think tank outputs, such as “Research Fronts” and “Mapping Science Structure” based on the analysis of high impact papers, and “Technology Focus” and “Mapping Technology Structure” based on the analysis of high value patents.
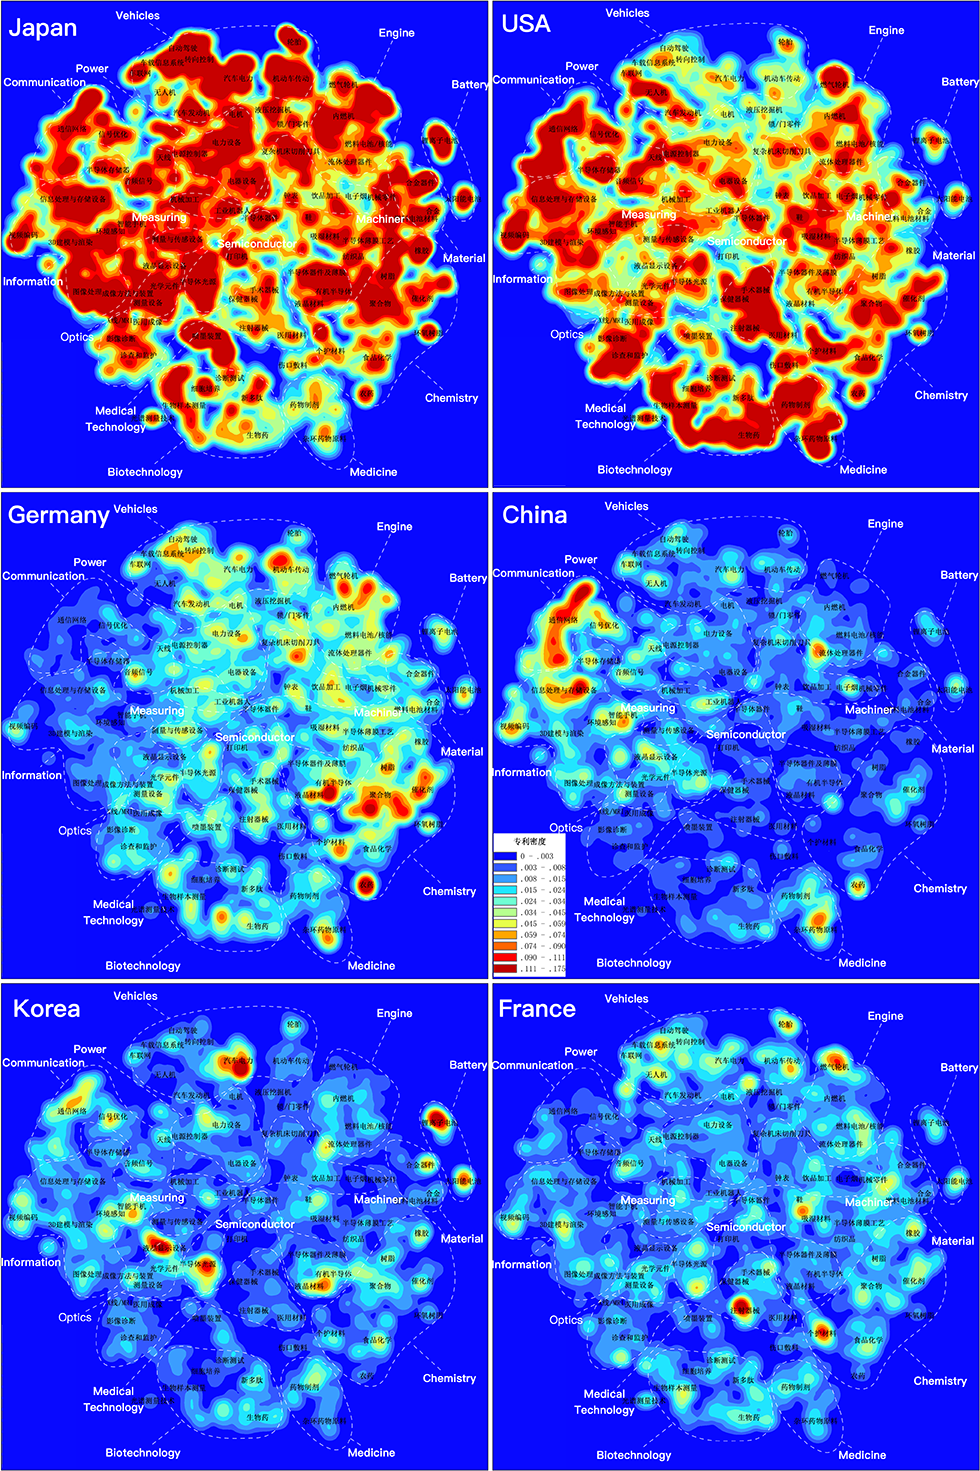
Fig. 2 Six nations’ triadic patent share overlay maps show the share of triadic patents of six countries in different technological focuses. The brighter the color, the higher the share. [IMAGE: CASISD]
From the perspective of the overall technology focus layout, Japan and the United States have absolute advantages in both the number of triadic patents and the coverage of technology focuses, with the share of triadic patents in each technology field exceeding 10 percent. Japan and the United States are also complementary in the technologically advantageous fields at the top and bottom of the map, with Japan having obvious advantages in the vehicles technology on the top of the map and the United States showing advantages in medicine and medical treatment at the bottom of the map. China and Germany have obvious advantages in communication and computer technology as well as in chemical engineering and mechanical engineering respectively on the left and right of the map. In addition, France and Germany have similarities in the shares of technology fields of the World Intellectual Property Organization (See Fig. 2).
Source: Institutes of Science and Development,
Chinese Academy of Sciences